Design Reports Directly in Your Browser
Web Report Designer
No installation required
The Web Report Designer is browser-based. There is no need to deploy or maintain client software. Updates and customizations are performed centrally on the server, without the need to roll out to individual devices.
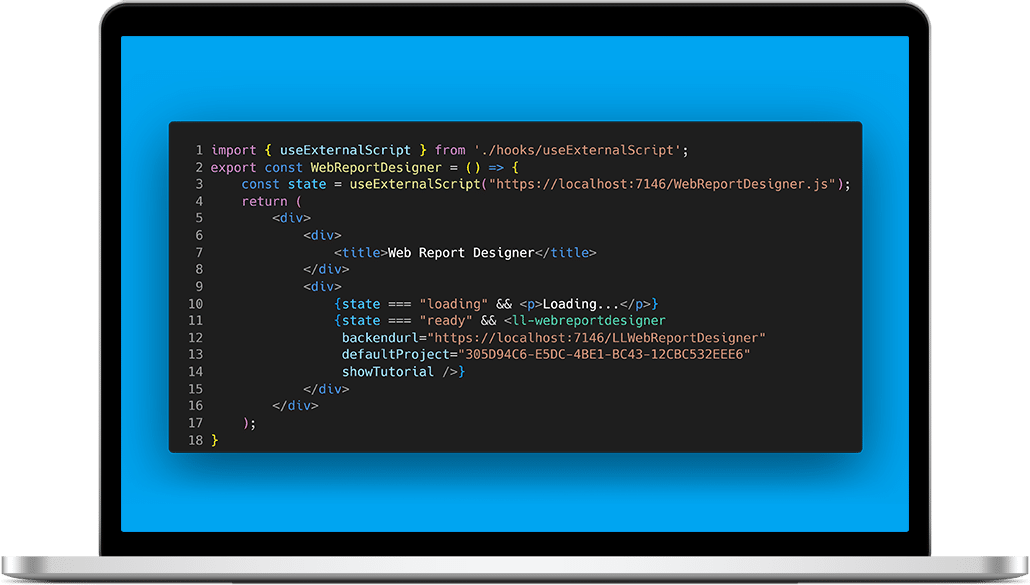
Free choice of front-end
The Web Report Designer is based on web component technology, which allows for flexible integration with all popular JavaScript frameworks such as React, Angular, or Vue.
Platform-independent in the browser
The designer interface is optimized for all major browsers on desktop and tablet devices. This allows users to create reports platform-independent on Windows, MacOS, Android or Linux.
Get to know the Web Report Designer
In our video, we introduce you to the structure of the designer interface and its features.
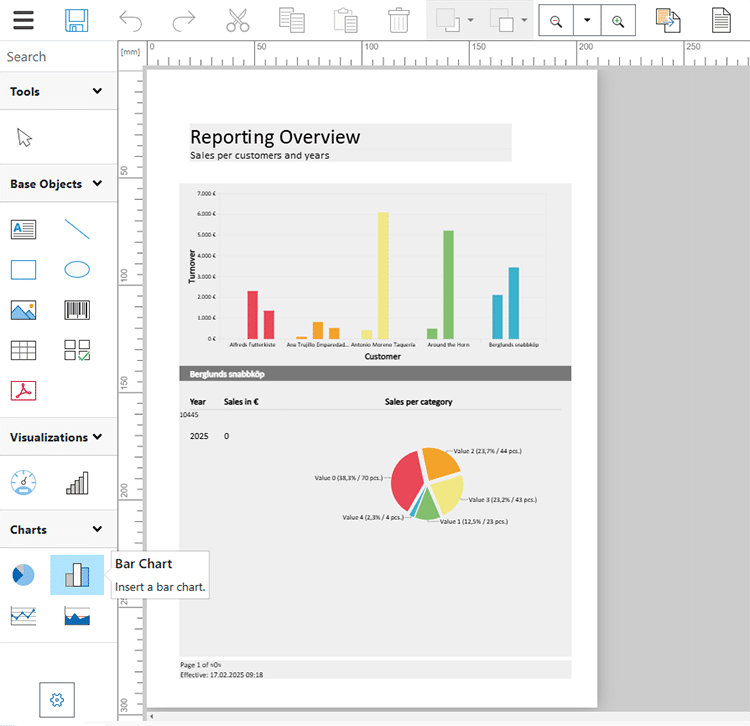
Design & Layout
Object Positioning: Unlike banded designers, which are limited by fixed header, footer, and detail sections, the Web Report Designer allows for free placement and pixel-perfect alignment of objects in the workspace.
Drag & Drop: Easily place and adjust fields, objects, and layouts with intuitive drag & drop functionality for flexible report design.
Layers: Organize your report content on separate layers with individual visibility, custom print conditions, and independent editing – ideal for clear structures and customized presentations.
Page Layout and Design Customization: Adjust the page size, margins, orientation (portrait or landscape), fonts, and colors to achieve an appealing and professional appearance.
Templates: Use predefined layouts and color schemes to create reports quickly and consistently, or customize the templates to meet your specific needs.
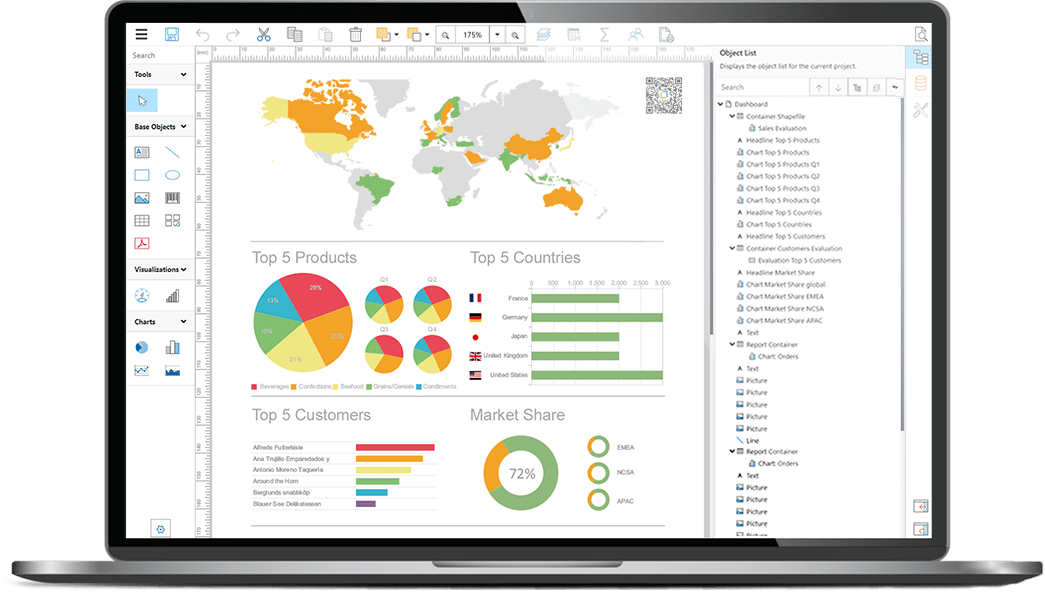
Data Visualization
Text Objects: Create dynamic and static text such as titles, descriptions, or automatically generated content (e.g., date and page number) with extensive formatting options for font, size, color, and alignment.
Tables: Organize data in easy-to-read tables with sorting, filtering functions and aggregation (sum, average, min/max). Color highlighting and layout adjustments enhance readability.
Charts: Visualize data with bar, line, pie, and area charts. Customize colors, axis titles, and sizes individually to create clear, easy-to-understand charts.
Visualizations: Clearly display key metrics in your report with circular or thermometer gauges and data graphs with multiple symbol variations. Customize scales, colors, and labels.
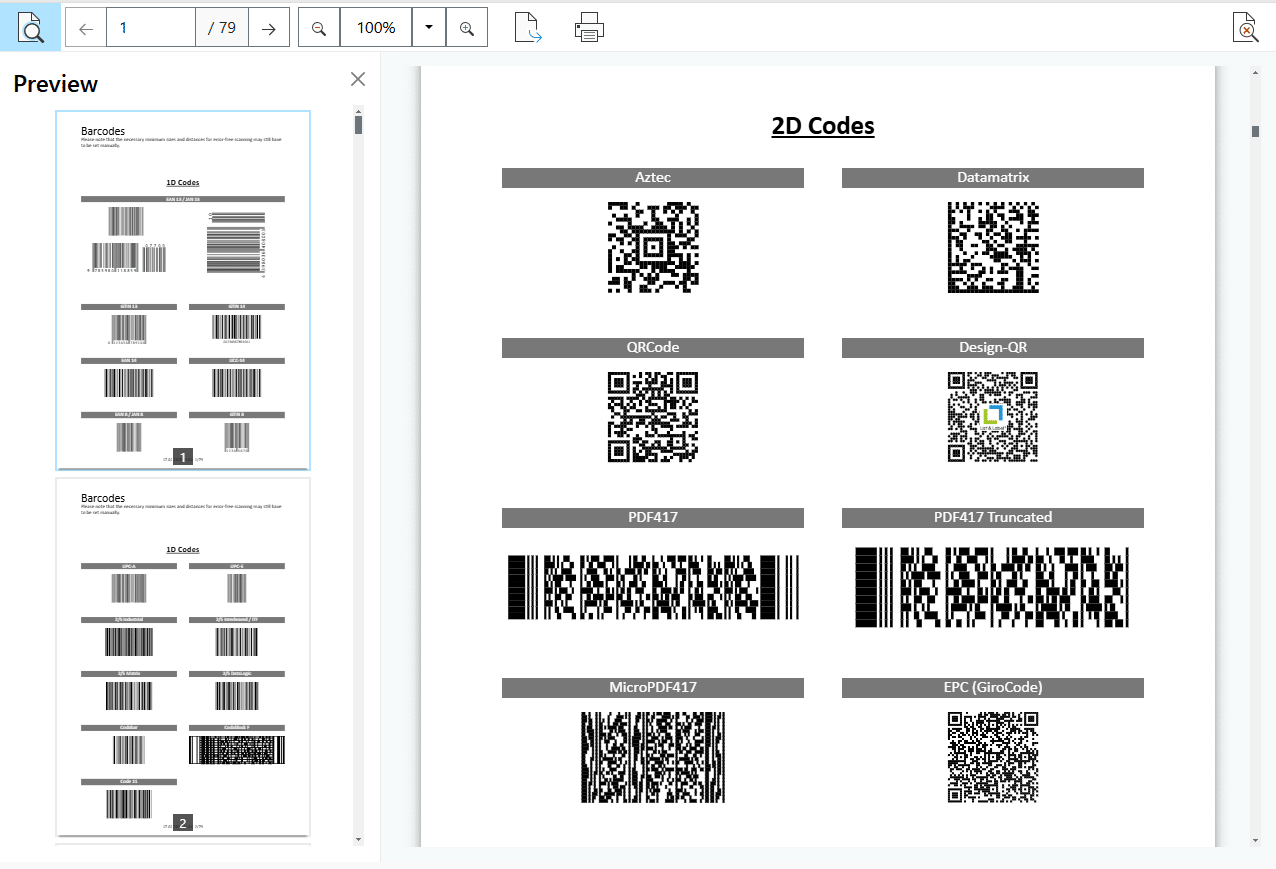
More Objects for Visualization
Barcodes: Generate standard barcodes (e.g., QR code, DataMatrix) with dynamic data. Barcodes can be adjusted in size, position, and text display.
PDF Integration: Embed PDF documents directly into your reports and take advantage of extensive configuration options. Select specific pages, define position and size individually, adjust orientation and scaling, or use the PDF as a background or overlay.
Pictures: Integrate static or dynamic pictures such as logos or product photos in various formats (e.g., SVG, PNG, and JPEG) and adjust them flexibly (size, frame, shadow). Ideal for personalized reports.
Checkboxes: Use checkboxes in surveys, checklists, or data entry forms to visually represent Boolean values. The design can be customized individually by uploading custom symbols or images for the checkbox states.
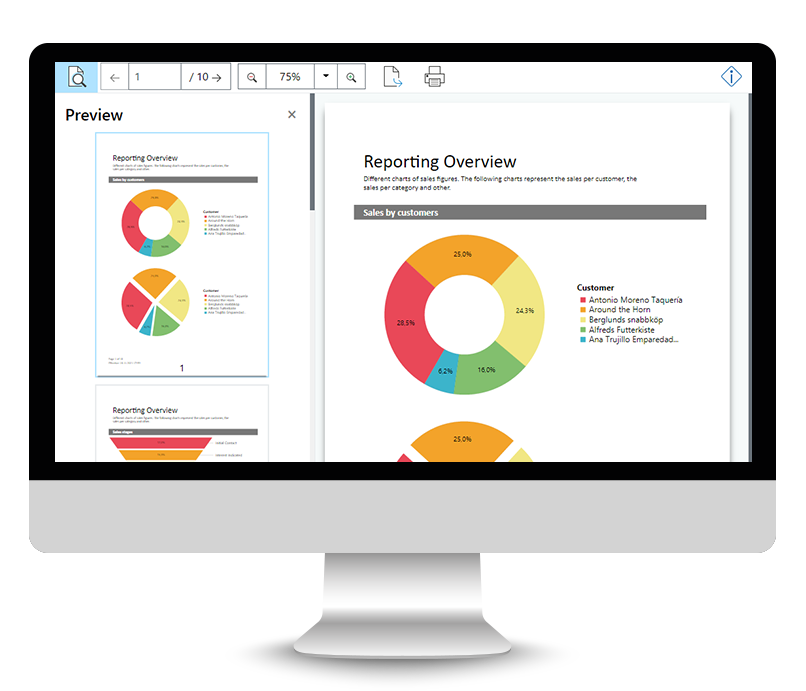
Experience your reports in a realistic preview that displays the final layout, including formatting and embedded objects – always based on the latest data. This allows you to perform an immediate quality check before exporting or printing the reports.
Developers can customize the designer and the real-time preview, for example, by enabling or disabling specific menu options or tools to tailor the functionality to the needs of the end users.
Accessible and Inclusive:
The Web Report Designer is Section 508-compliant and offers screen reader compatibility, keyboard navigation, and customizable display options – ensuring optimal accessibility and a better user experience. Download the VPAT PDF.
Report Functions
Project Include: Reuse layouts, objects, or templates such as logos, tables, or headers across multiple reports to create a consistent design or comply with CI guidelines, making your work more efficient.
Formula Wizard: Create dynamic calculations, conditional formatting and aggregations. The formula wizard makes it easy to define variables, summation functions, and logical expressions – without writing complex code.
User and Sum Variables: Define individual values and aggregate data across groups, integrating them seamlessly into formulas, conditions, or calculations.
Printer Settings: Select printers, page ranges, paper sizes, number of copies, duplex printing, and paper trays for user-defined outputs.
25 Export Formats: Export your reports to formats such as PDF, Excel, Word, PowerPoint, JSON, XML, CSV, or image files (such as SVG, PNG, and JPEG)—ideal for further processing, presentations, data sharing, or web integration.
Supported Languages: The user interface is multilingual, making it suitable for use in international projects. Available languages: English, German, French, Spanish, Italian, Dutch, Portuguese, Slovak, Czech, Japanese, and Simplified Chinese.
Interactive Features
Sorting Options: Sort data based on individual criteria, including alphabetical, numerical, or date-based sequences. You can also combine multiple sort levels, such as sorting first by category (e.g., “Region”) and then by value (e.g., “Revenue”). In addition, you can set custom sort rules using formulas and conditions.
Expandable Regions: Enable interactive content where users can expand or collapse sections to dynamically display details, improving report clarity. Thanks to the lazy load function, only the necessary information in the expanded sections is loaded. This saves server performance, reduces load times, and improves the user experience, especially when handling large datasets in web applications.
Data Filter and Drilldown Function
Filtering Options: With the integrated filter options in the designer, you can specifically select relevant datasets for your reports. Data filters can be defined at the field level for tables as well as globally for the entire report. User-defined formulas and conditions can be applied to cover complex scenarios, such as sales data within a specific time frame or for a particular region.
Report Parameters: Define report parameters that allow users to interactively filter data based on specific criteria, such as time periods, categories, or location data. Tip: Use the selected report parameters directly as data filters.
Drilldown Reports: Create interactive data analysis reports that allow users to click on report elements to view detailed information using data relationships or dynamic report parameters.
Web Report Viewer
The Web Report Viewer allows you to view and analyze reports directly in your web browser. Its responsive layout flexibly adapts to different screen sizes, ensuring an optimal user experience on any device. The Web Report Viewer is an integral part of the Web Report Designer but can also be used independently.
Interactive and Intuitive Navigation
Use interactive features such as drilldown, sorting, and filter conditions with report parameters in the preview to gain detailed insights into data. Easily navigate through pages, zoom into details, or jump directly to specific sections.
Efficient and Scalable
The Web Report Viewer offers fast load times by caching frequently used data, and is powerful enough to efficiently display large reports with large amounts of data.
Export and Print from the Preview
Reports can be exported to various formats (e.g., PDF, Excel) or printed directly from the preview. This allows for seamless further processing of the data.
How to Integrate the Web Report Designer in ASP.NET
Online documentation | Tutorials | Sample applications
FAQ
Can existing List & Label projects from the desktop version also be edited in the Web Report Designer?
Yes, existing List & Label projects from the desktop version are compatible with the Web Report Designer.
In which editions is the Web Report Designer available?
The Web Report Designer is included free of charge in the Enterprise Edition.
How often will the Web Report Designer be updated?
You don’t have to wait for the next release of List & Label to get improvements in the Web Report Designer. We regularly release incremental releases with new features.
Does the back end still require a Windows environment?
Yes, the Web Report Designer requires a Windows environment for the back-end.