List & Label 24
Effective Background Support
The new version List & Label 24 brings you and your customers new visualization possibilities, detail improvements and a performance boost. You and your customers will benefit from it! Take a look at all new features here.
List & Label 24
Effective Background Support
The new version List & Label 24 brings you and your customers new visualization possibilities, detail improvements and a performance boost. You and your customers will benefit from it! Take a look at all new features here
Designer & Preview
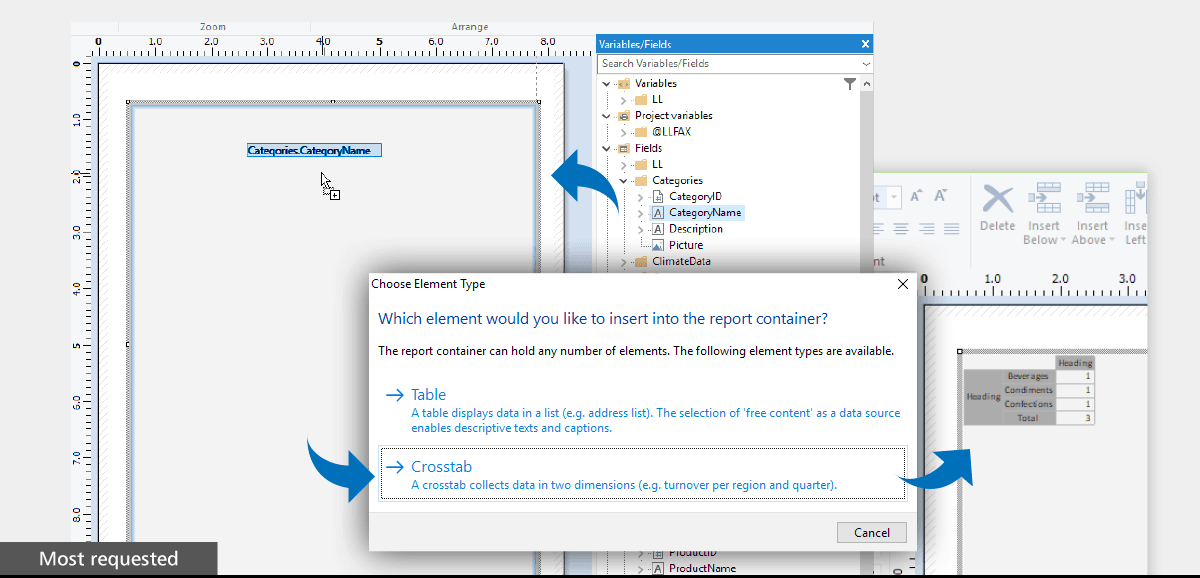
Crosstabs via drag & drop,
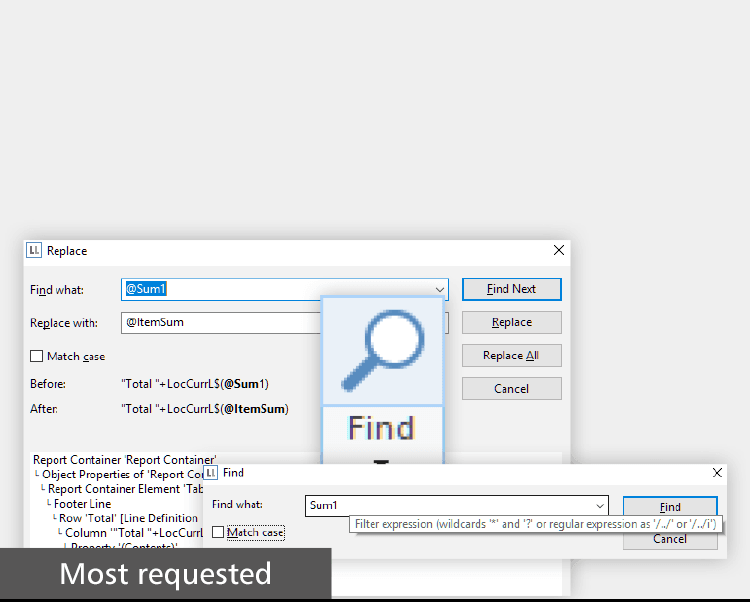
find and replace,
customized preview, …
Web & .NET
Parametrized data sources,
HTML5 Viewer: SVG and drill-
down for charts, …
Report Server
Native apps for iOS and Android, new actions for scheduled reports, …
Other New Features
Enhanced performance, Rscript
for additional charts, animations for XHTML export, …
Designer & Preview
For your users the report designer is the interface to professional reports, evaluations, documents, PDFs, etc. Our goal: to continuously improve the WYSIWYG Designer.
Creating Crosstabs via Drag & Drop
You can now create both tables and crosstabs simply by dragging fields to your workspace. This is a very intuitive way to build a basic crosstab that you can edit later.
Find and Replace
This function allows you to quickly and easily adapt reports to changed field names, tables, variables, and so on.
Seamless Refresh for Preview
The preview is now seamlessly refreshed when new content has been generated.
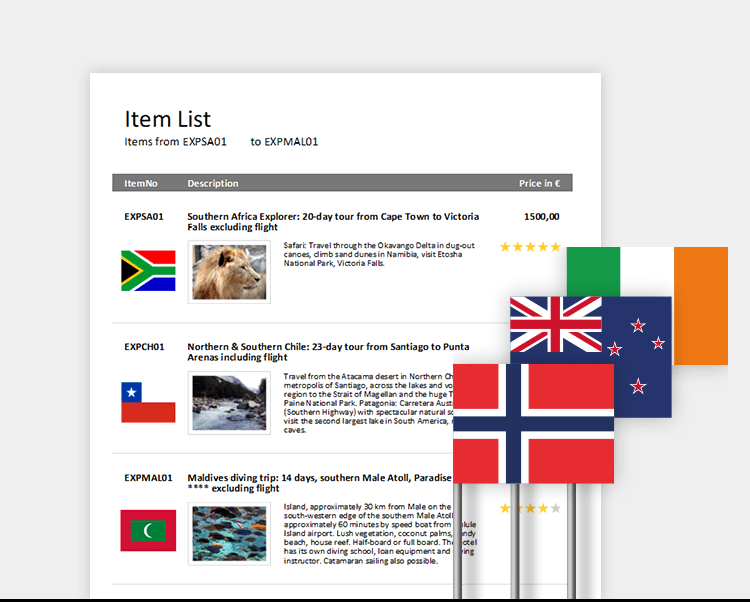
Country Flags
The new CountryFlag function enables you to create an SVG graphic of the required country flag anywhere in your report.
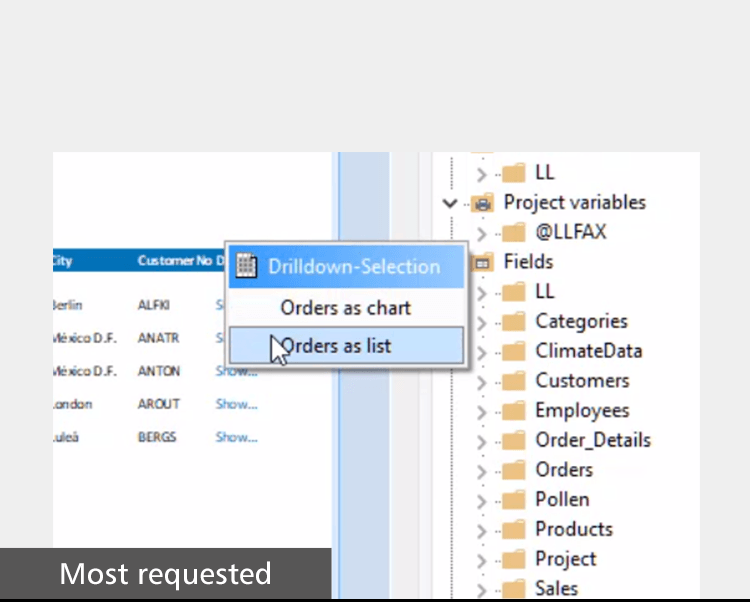
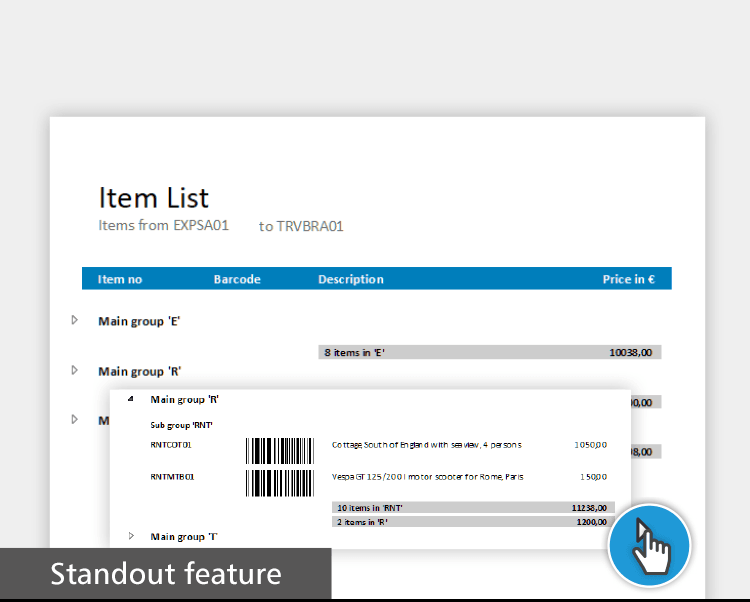
Expandable Regions for Groups
You can intuitively drilldown within grouped lists by expanding and collapsing selected regions.
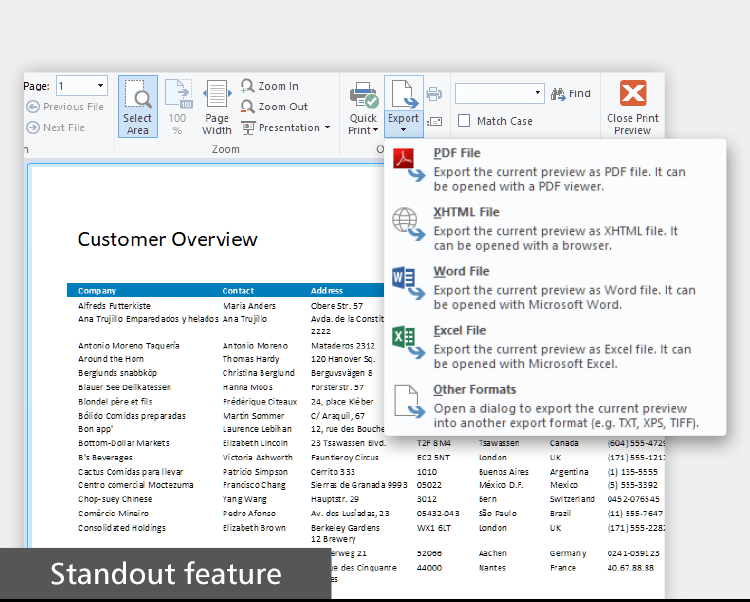
Embedded Export Formats
Export formats can be embedded in preview files for later export
to Microsoft Excel and Word, MHTML and XHTML – in addition
to PDF and the graphics formats that LL already offers.
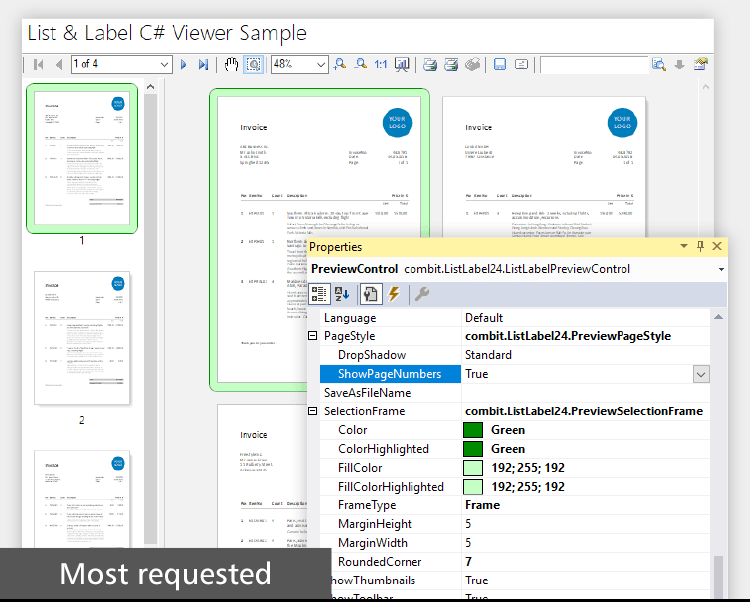
Preview Tailored to Your Application
A variety of settings allow you to tailor the preview to your application’s look & feel.
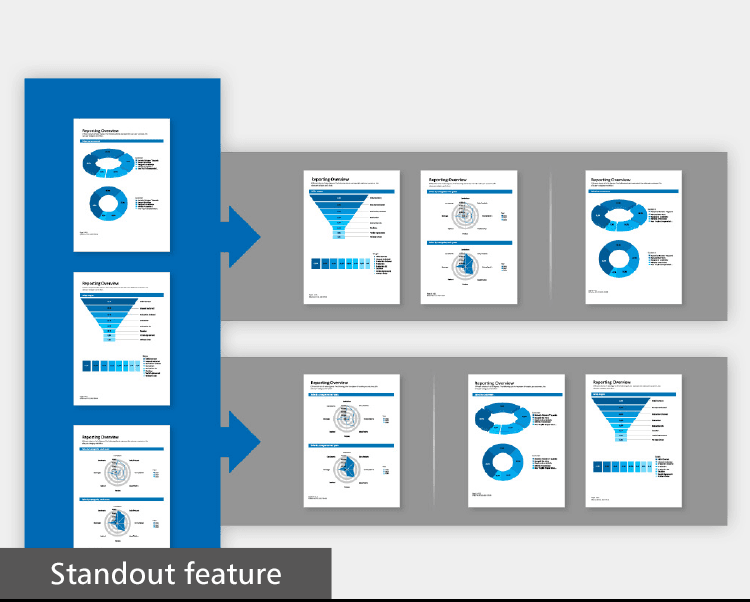
Create Preview From Individual Pages
Break down the preview into your preferred page ranges. You can then recombine the resulting individual files in any order.
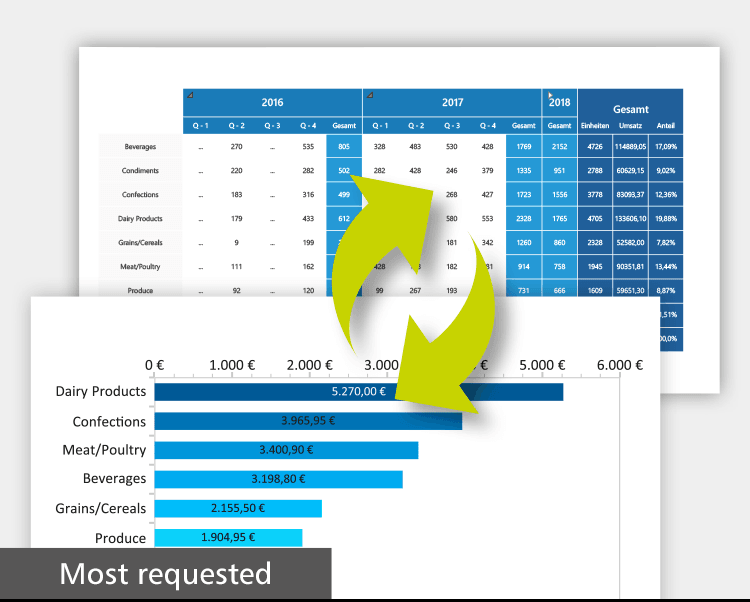
Converting Crosstabs to Charts and Vice Versa
This can now be performed directly from within the object window or ribbon.
Web & .NET
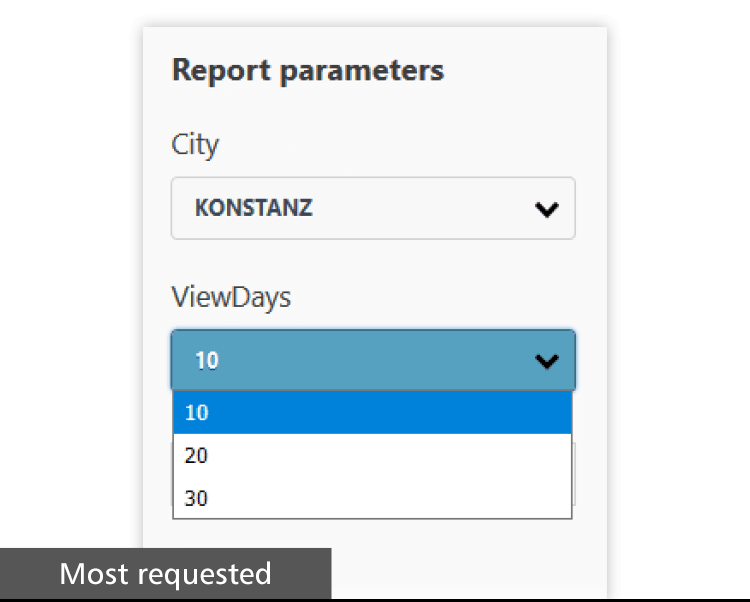
Parametrized Data Sources
The powerful report parameters can now be created automatically by parametrized data sources.
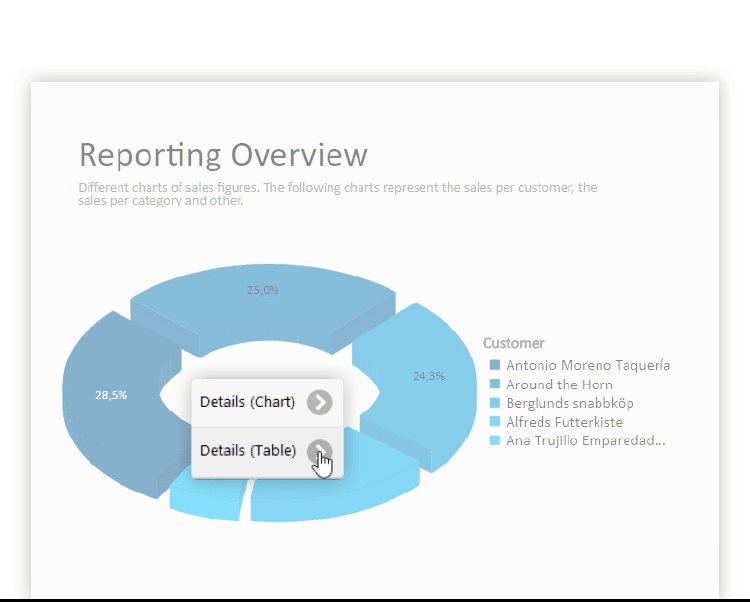
HTML5 Viewer: Drilldown Support in Charts
Now, we introduce drilldown in charts to your web reporting. With a simple click in the chart you get the corresponding drilldown report.
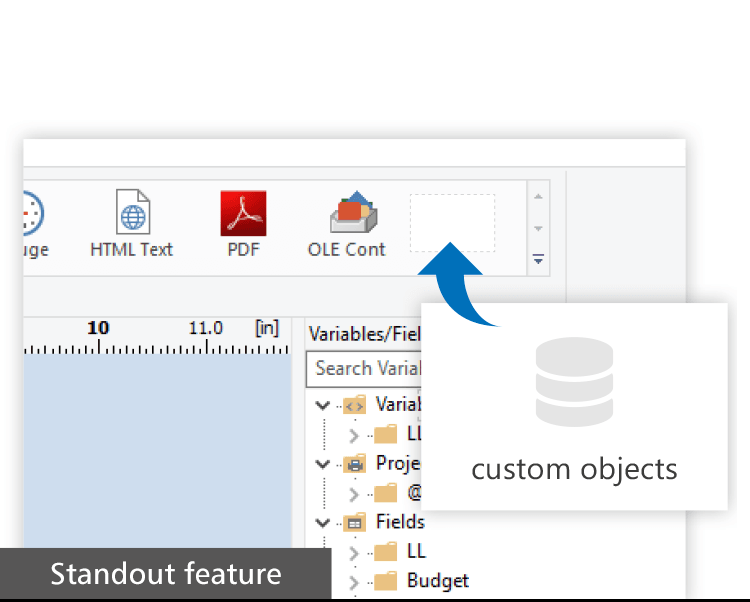
Web Designer: Customized Objects/Functions
Add your customized Designer functions and Designer objects to the Web Designer configuration on the server to make them available to clients.
SVG-Format Charts in the HTML5 Viewer
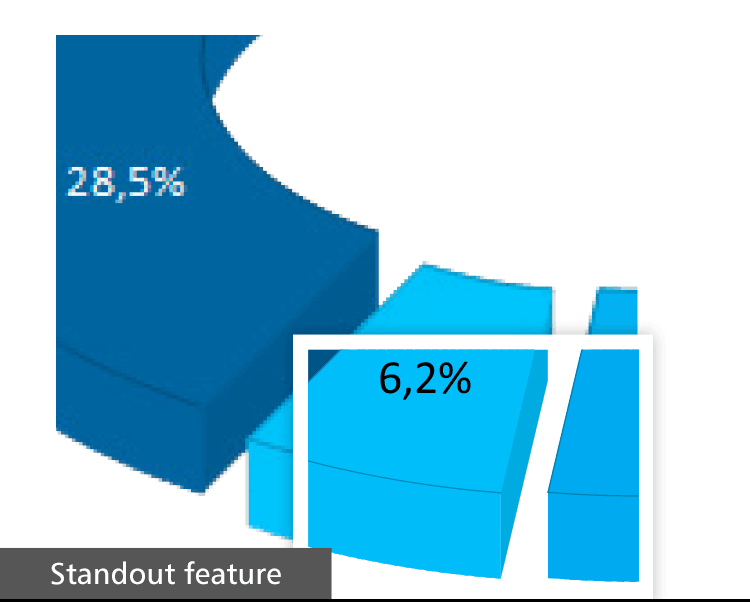
In browsers, all charts, shapefiles (e.g. for geovisualization) and barcodes are now rendered in SVG format and thus always displayed in high quality.
Report Server
New Actions for Scheduled Reports
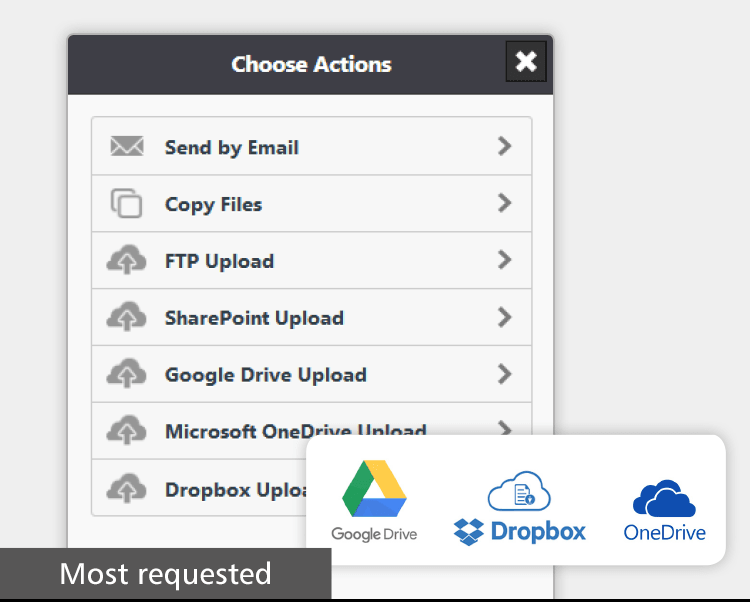
In addition to distribution by email, via FTP or Microsoft SharePoint, scheduled reports can now be uploaded to Google Drive, Dropbox, or Microsoft OneDrive.
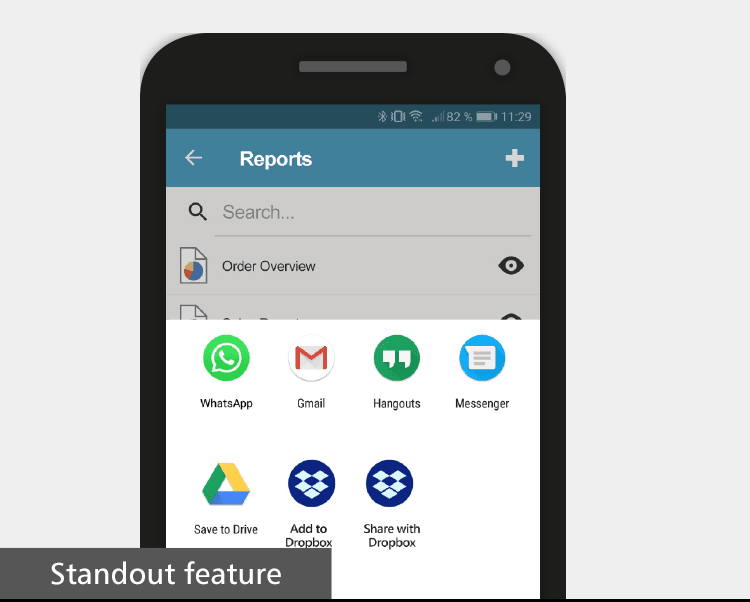
Native Apps for iOS and Android
The new Report Server apps let you access key Report Server functions natively on almost any mobile device.
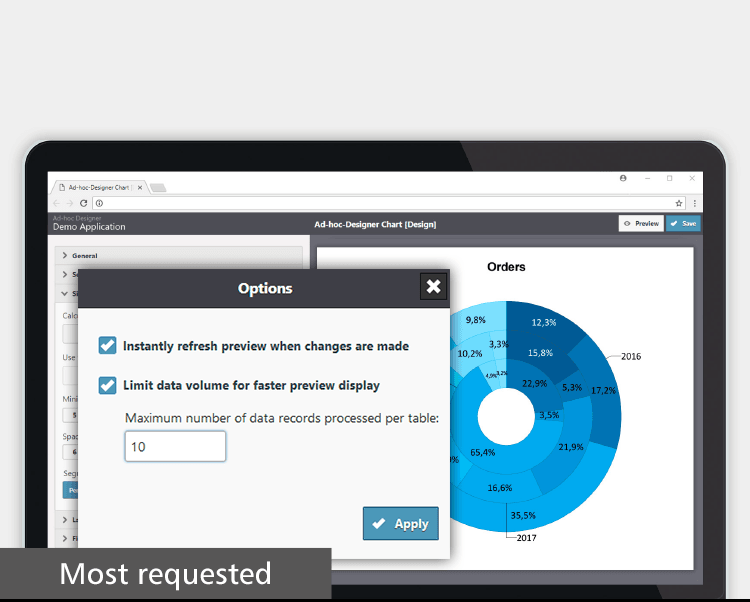
Requested Features in the Ad-hoc Designer
Especially in the Ad-hoc Designer, many customer requests have been implemented to make it even more intuitive for your users.
Other New Features
Performance
We have again succeeded in boosting List & Label’s processing speed significantly. In list projects, you benefit from 20% higher speeds on average!
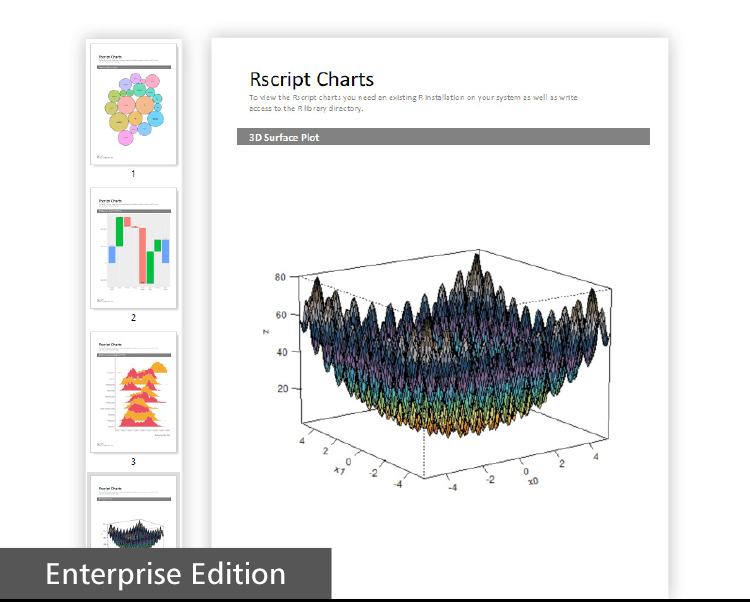
Rscript for Additional Charts
We have connected Rscript to List & Label to give you even greater choice of visualization in addition to the directly available charts in List & Label.
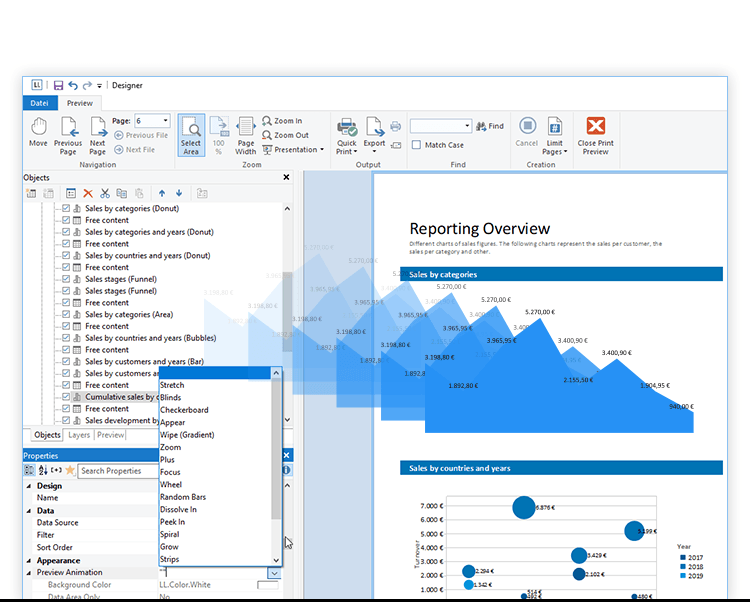
Animations for XHTML Export
As with the animations in the preview, you now define the behavior of the objects displayed in the browser.
Nested Tables
Nested tables are now supported in group headers and header lines.
Lifecycle
Because there are no barriers to communication, we can respond to market demands quickly and flexibly. This guarantees the high quality of our product. Customer requirements play a key role in our development process. Upgrades always deliver a variety of new features, and are frequently revised to ensure they remain cutting edge.
[content_timeline id=”1″]
Lifecycle
Because there are no barriers to communication, we can respond to market demands quickly and flexibly. This guarantees the high quality of our product. Customer requirements play a key role in our development process. Upgrades always deliver a variety of new features, and are frequently revised to ensure they remain cutting edge.
Version 24
Release: 10/2018
Version 23
Release: 10/2017
Version 22
Release: 10/2016
Version 21
Release: 10/2015
Version 20
Release: 10/2014
Version 19
Release: 10/2013
Version 18
Release: 10/2012
Version 17
Release: 10/2011
Version 16
Release: 10/2010
Version 15
Release: 10/2009
Version 14
Release: 10/2008
Version 13
Release: 11/2007
Version 12
Release: 10/2006
Version 11
Release: 07/2005
Version 10
Release: 11/2003
Version 9.0
Release: 11/2002
Version 8.0
Release: 07/2001
Version 7.0
Release: 05/2000
Version 6.0
Release: 02/1999
Version 5.0
Release: 10/1997
Version 4.0
Release: 09/1996
Version 3.5
Release: 02/1995
Version 3.0
Release: 04/1994
Version 2.0
Release: 05/1993
Version 1.1
Release: 10/1992
Version 1.0
Release: 07/1992
