Report Designer
- Royalty-free deployment to end-users
- Office look & feel for intuitive use
- Pixel perfect report design
- Available in more than ten languages

Awarded in:
Data Visualization
Reporting
Embedded Analytics
Report Designer that Integrates Into Your Application
The Report Designer is the part of List & Label your end users come into contact with. The WYSIWYG Report Designer enables you to quickly integrate powerful functionality into your application, establish a distinct competitive advantage, and provide your users with the flexibility they need to create pixel perfect reports.
Overview
The object list determines the structure of your report. You can change the order with point-and-click simplicity.
Dynamic Properties
You can use formulas to make any property conditional on data used to generate the report at runtime – i.e. this data determines properties such as language, position and formatting.
Quick Testing
In the preview, you generate your reports with real data. With a single click you can check the layout or view a fully populated report within the Designer ad-hoc while you work.
Extensible
Add your own objects, functions and actions to the ribbon to give your users the right options at the right time. That makes the design process quick, easy and convenient.
Barcodes Included
More than 50 barcode types are included free of charge, and no special barcode fonts are needed.
Start Immediately
Available variables and fields are displayed at all times, making it simple even for beginners to create reports. You and your customers benefit from convenient drag-and-drop design capabilities.
No Additional Cost
You are free to distribute the Designer without paying additional fees. Enrich your application with cutting-edge reporting capabilities for any type of output, with minimal coding.
Report Designer With Endless Possibilities
Integrate powerful functionality into your application.
Rich Designer Objects
Add simple tables, comprehensive master-detail reports/subreports, crosstabs, charts, RTF text, barcodes, graphics, PDF objects, user defined objects and more.
Chart Types
Employ a wide variety of data visualization options to enhance your reports with professional visuals: charts, gauges, shapefiles, Rscript support for custom chart types and much more.
Data Binding
Choose between more than 30 included data providers for a variety of different data sources such as SQL, Oracle, XML, LINQ, NoSQL, CSV or Business Objects/ORM.
Languages
Functional Principle
List & Label is integrated into your application, regardless of whether it is a desktop or server/web server application. Then you define the data sources: via data binding or without database or via our data providers.
Interactive Reporting
List & Label’s preview offers a host of interactive features, making reports even more comprehensive, and offering your users richer and more intuitive functionality, where supported by your application.
Report Parameters
Enable your users to select specific values in the preview. This way, they can define which information should be displayed.
Interactive Drilldown
Your users can drill down the hierarchy from summary information to more detailed data. Drilldown is a simple method of exploring multi-dimensional data.
Expandable Regions
The expandable regions offer a drilldown function, providing users with clearly structured information. Your users will be able to “zoom in” on the details they need.
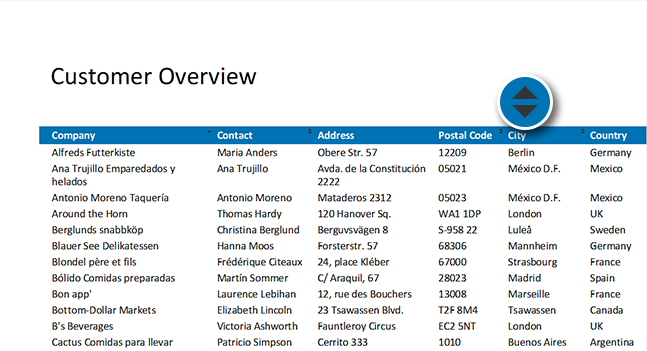
Sorting
You can change the sort order simply by clicking on the corresponding column header: Only one report for several use cases.

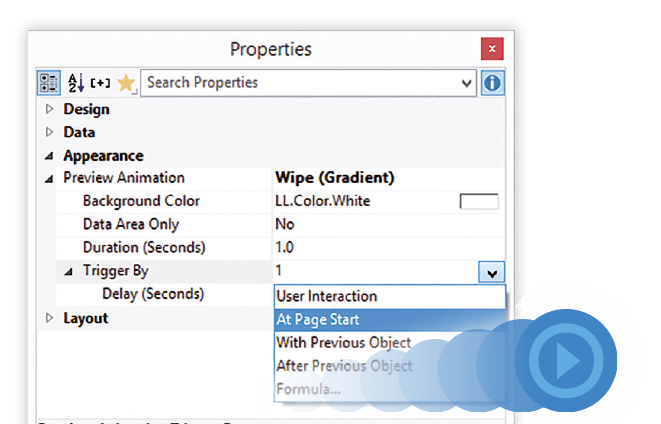
Animation
Instead of using presentation software, animate report objects in the preview window. This way, your presentations get greater impact and keep your audience engaged.
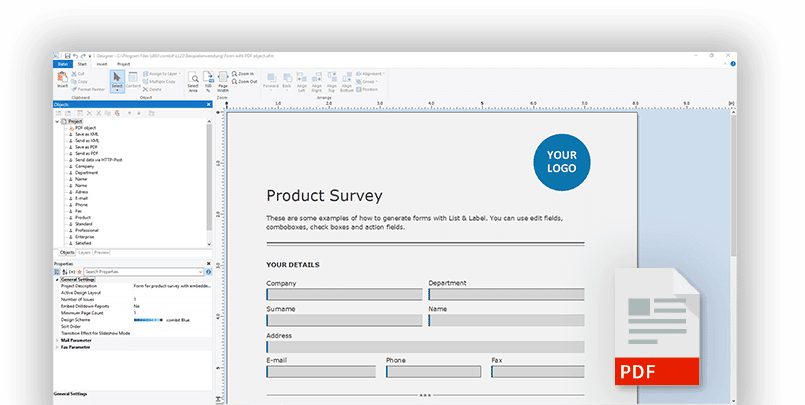
Forms
Your users design forms in the Report Designer whose elements are retained as far as possible after the PDF export. These can then be edited in the PDF later.

Test Fully Functional 30-Day Trial Version for Free


