8 Steps to
Find the Best Reporting Tool

How to Find the Best Reporting Tool for Your Application
Naturally, it depends on your requirements, what reporting tool would be the right fit for you. First of all, you need to decide if you want to go with a purchased product. Another option is to develop the required functionalities yourself. Depending on the nature of your application, this could be the most feasible and flexible solution. Just remember: for all further enhancements, new technologies and support requests, it’s up to you to deal with it. In most cases it makes a lot of sense to consider a professional component. With these 8 guiding questions, you will find the best match.
 Integrated or out-of-the-box?
If you decided to go with a reporting tool, you’d need to decide if you want an integrated component, or if you’d rather get an out-of-the-box product. Picking an integrated solution means that it will need to be embedded into your application’s source code. For the most part, a few lines of code are sufficient to do so. This provides you with maximum flexibility to tailor reports, invoices, lists and labels to your customers’ needs.
If you’re looking for a solution which is ready to go right away and doesn’t require any changes to your application, then a server based reporting tool would be a good fit. Here, the market offers whatever your heart desires, from sophisticated BI Suites to Open Source software for the smaller budget. The big advantage is, it works platform independently, is easy to scale and offers automatic reporting functions.
 What kind of IDE will be used?
In case you want to integrate the component into your application, it needs to support the programming language and IDE. Just a quick note: if you’re a .NET developer, you’re spoiled for choice. Most components are specialized for the Microsoft Framework. For Delphi, Java or C++, the choices are considerably smaller. Therefore, the tools that support different IDEs and programming languages, offer great benefits. Even if you switch to a different language, your reporting templates can be taken over – under the condition that you’re using the same data structure.

 What kind of data sources need to be connected?
Do you want to connect the tool to SQL based data sources like MS SQL Server, MySQL or Oracle? Are file-based data sources like JSON, XML or Excel important for you? Your reporting tool of choice should include the right data providers for every database. If this is not granted, you will run exactly into the problem you wanted to avoid from the beginning: you would have to do some coding yourself.
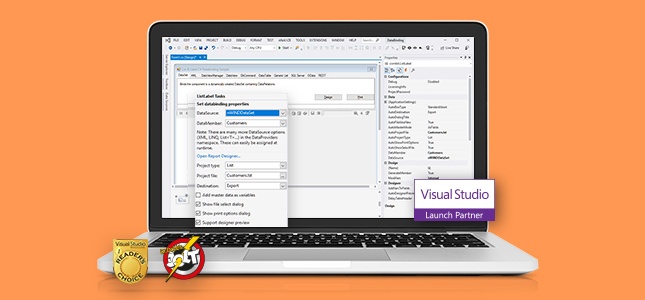
Not to forget the administrative rights. Is every end user supposed to access all data? Or would you want to pre-configure the constellations? The List & Label Designer, as an example, is based on data which are provided by the program. This means you have total control over selection and combination of data, and existing user rights determine.
 Freedom of design – what do you want your customers to have?
A reporting tool provides a designer to create the desired reports. Some providers even allow you to forward the designer to your end users – in some cases even royalty free. If you deploy the designer to your end customers, or if you prefer to offer template design and customization as a service, is completely up to you. In case of redistribution, ask yourself the following:
- Which functions do you want to offer? Would you provide the designer in a simplified version, or including the full range of possibilities?
- Do you want to offer different languages for the dialogs? What about special barcode formats or filters?
- What kind of templates do your customers need to reach the best-possible end results?
Get Started with Our Dev Guides
 Visualization – what about the looks?
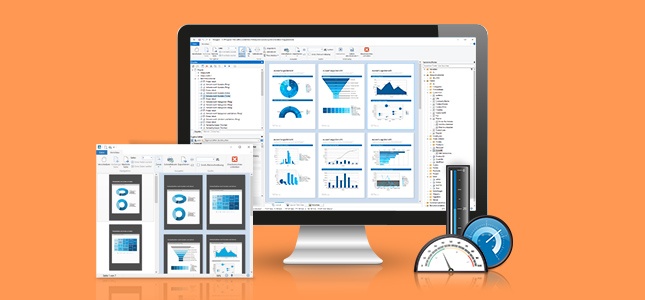
The visual aspect is the most important function a reporting tool has. It strongly determines your reports’ aesthetics and impression. Make sure to compare what different tools have to offer in regards to visual effects. Create a list with must-haves and nice-to-haves in regards of formats. For your information: a powerful reporting tool offers the following possibilities:
- Charts (including Gantt, treemap, gauges….)
- Tables/Cross tables/nested tables
- Interactive functions like drill down, as well as drop down areas and sorting options
- Maps/Shapefiles
- Side by side reports
- Royalty free barcode formats
- Numerous supported image formats
- Support for PDF contents
- Formula functions

 What’s your applications’ focus?
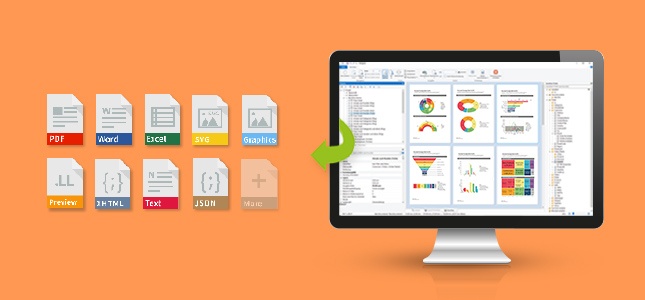
Do you primarily need printing functions? Enhanced options for export? Or do you rather focus on presentations and redistribution? Usually, a reporting tool covers all of these areas. It’s important though to thoroughly compare the manufacturers’ choices regarding export formats, since they vary quite a bit, and you would not want to end up having to manually convert your reports. Another thing to consider is your application’s deployment: a tool providing xcopy-deployment, or a redistribution wizard, guarantees a way easier redistribution process.

 What about support services?
Imagine you’re just finished with the integration of a reporting component into your application, and all of a sudden you’re running into a problem and don’t know what to do. Quick and qualified support assistance is key, preferably by the manufacturer itself. Wherever you’re planning on buying your tool, make sure the manufacturer offers easy accessible inhouse-support. Additionally, you will find large and well-established developer communities built around successful products and their manufacturers. The combit reporting forum is an excellent example. It gives you a chance to network with the combit support team, as well as with other developers, to exchange information and to benefit from the community’s knowledge and experience.
 What about licensing conditions and price-performance ratio? How do I avoid hidden costs?
Sometimes it can be very difficult to get a grip on actual costs for a tool in advance. There might be additional costs for designer runtime fees, for new modules, support and maintenance. It’s often very difficult to compare licensing models and price structures of different software providers. Be safe. Describe your very individual scenario and receive a quote which is tailored to your needs. This is also a great opportunity to find out about response times and flexibility of each provider. Ask for possible hidden or added costs, and balance your benefits against your expenses. One thing is the same for all solutions: the more efficient all functionalities can be used, the faster your expenses will be amortised. Therefore, it makes sense to check if you can use some of the included features to replace other solutions you’re using and paying – i.e. a PDF generator, or a barcode tool.
To sum it up:
There are probably even more questions which we did not answer right here in this blog post. But hopefully we were able to provide a few helpful hints to start your quest for a suitable reporting solution.


